Probability of Hitting Deadlines Based on Pivotal Tracker Points
Introduction
As software developers, we know how important it is to give reliable time estimates to the business. Business people would like to know how long milestones will get done so that they can reprioritize goals if needed. However, estimating the time it takes to develop software is hard:
So many things can introduce variability into how long stories get done in relation to the estimates:
- unforeseen complications
- someone who used to work on your backlog is pulled out and tasked to focus on a different project.
- someone you need in order to keep moving on the story, is in a meeting with other people.
- coworker takes paid time off.
Time estimation is hard, and that is why agile project management software like
Pivotal Tracker lets developers estimate complexity instead: stories
estimated as 1 are easy, 2 as medium, etc. Pivotal Tracker calculates
velocity, which is how fast the team is able to finish stories, taking
into account the complexity, averaged over time. With this calculation it makes
a prediction as to how many stories can be done in one iteration or sprint.
However, this system might be too simplistic. For example, 20 points made up of
20 1-pointers might drastically be done faster than 10 2-pointers. In order to
test this hunch, I extracted the product development accepted stories (feature,
bug, chore) and calculated the elapsed time between the time stories were
started and the time stories were delivered, for the last six months. I came up
with the following probability distributions (rounded to the nearest hour,
assuming a 40-hour workweek, with major outliers removed):
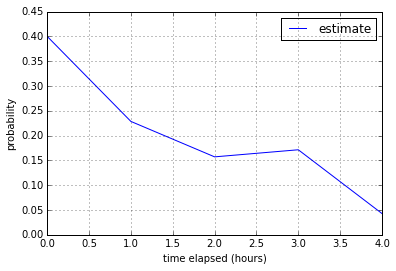
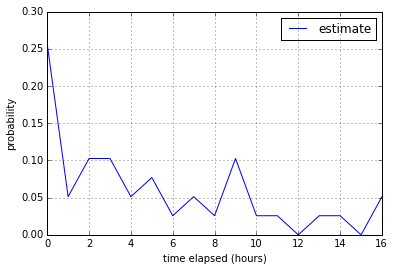
Looking at the histograms of 1-point stories and 2-point stories verifies the
intuition that a backlog that is dominated by 2-point stories will probably
take longer than a backlog that isn’t, given that the total points are the same.
2-pointers have a lot more variability than 1-pointers, even with outliers
removed.
In this article, I use a technique that accounts for variability in the
distributions of stories estimated as 1-point and 2-points over the time
taken to finish those stories. My hope is that when a project manager asks
us how confident we are that we will finish a number of stories by X date, we
could:
- give them a sound answer that is firmly rooted in data to guide our intuition.
- augment the existing project management tools so that we could give more reliable estimates.
Computing the probability of how long milestones will take
So how do we calculate our “confidence” in finishing a milestone, given that
X amount of stories are estimated to be 1-point and Y amount of stories are
estimated to be 2-points?
According to Wikipedia:
In probability theory, the probability distribution of the sum of two independent random variables is the convolution of their individual distributions.

The independent random variables we would like to consider, more explicitly, are that of times elapsed given a story estimate (one-point and two-points).
For example, let’s say a milestone has 5 1-pointers and 2 2-pointers. Let’s
represent the time-elapsed distribution over a 1-pointer as A, and let’s
represent the time-elapsed distribution over a 2-pointer as B. Thus, we could
get the T total distribution by convolving the distributions as follows:
where ∗ is the convolution operator.
What is convolution intuitively?
Assume you have two arrays of numbers. Convolution is the process of sliding
one array on top of the other, and multiplying the columns that line up with
one another, and then summing the result of the multiplications. For example,
let’s say A is an array of [1,2,3] and B is an array of [4,5,6].
Notice that I flipped one of the signals (B) so that that the first indices
are lined up:
      [1, 2, 3]
[6, 5, 4]
---------------
       4

      [1, 2, 3]
   [6, 5, 4]
---------------
       5+8

      [1, 2, 3]
      [6, 5, 4]
---------------
       6+10+12

      [1, 2, 3]
         [6, 5, 4]
---------------
         12+15

      [1, 2, 3]
            [6, 5, 4]
---------------
            18
The resulting array is the convolution:
How is convolution related to probability?
The following example is taken from this link Assume that you are rolling
two fair dice. What if we want to figure out the distribution of the
totals (i.e. calculate the probability that the sum will be 2, 3, 4, …
,11, 12)?
The probability of getting a sum of 2 is the probability of getting a 1 twice:
The probability of getting a sum of 3 is the probability of rolling a 1 and 2
plus the probability of rolling a 2 and a 1:
The probability of getting a sum of 4 is the probability of rolling a 1 and 3
plus the probability of rolling a 2 and 2, plus the probability of rolling a 3 and a 1:
We can represent this distribution of sums by convolution:
                           roll   |  1   2   3   4   5   6  |
                           ----------------------------------
                                   [1/6  1/6  1/6  1/6  1/6  1/6 ]
          [1/6  1/6  1/6  1/6  1/6  1/6 ]
        ----------------------------------
 roll   |   6    5    4    3    2    1  |

total                              1/36


                      roll   |  1    2    3    4    5    6  |
                             --------------------------------
                              [1/6  1/6  1/6  1/6  1/6  1/6 ]
          [1/6  1/6  1/6  1/6  1/6  1/6 ]
        ----------------------------------
 roll   |   6    5    4    3    2    1  |

total                         1/36+1/36


                      roll   |  1   2   3   4   5   6  |
                             --------------------------------
                              [1/6  1/6  1/6  1/6  1/6  1/6 ]
               [1/6  1/6  1/6  1/6  1/6  1/6 ]
             ----------------------------------
      roll   |   6    5    4    3    2    1  |

total                         1/36+1/36+1/36


                      roll   |  1   2   3   4   5   6  |
                             ---------------------------
                              [1/6  1/6  1/6  1/6  1/6  1/6 ]
                    [1/6  1/6  1/6  1/6  1/6  1/6 ]
                  ----------------------------------
           roll   |   6    5    4    3    2    1  |

total                         1/36+1/36+1/36+1/36
etc.
The distribution of sums is:
for
Let’s get back to our idea of finding the probability of getting a number of stories
that have variable estimates finished by a certain amount of time. So instead of
convolving the probability distribution of rolling a dice with itself to get
the probabilities of the sums, we will convolve the probability distributions
of time elapsed (from starting a story to delivering a story) of stories
estimated as 1-pointers with the probability distributions of time elapsed of
stories estimated as 2-pointers.
The number of convolutions we do will depend on the number of stories there are. So for
example, let’s say that the probability distribution of stories estimated as 1 is A(t)
and the probability distributions of stories estimated as 2 is B(t). If we have 3
1-pointer stories and 2 2-pointer stories, then we convolve as follows:
Once we have the total distribution of elapsed time, we can then answer the question
of “What is the probability of getting 3 1-pointer stories and 2 2-pointer stories
under 24 hours?” by adding the probabilities from 0 hours to 24 hours. Note that
looking at the probability at the 24th hour will only give you the probability that
those stories going to get done around 24 hours, not under. So we’ll make sure to add
from the 0th hour to the Xth hour if we’re trying to get the confidence level that
stories will get done under X hours.
Experiment
In the following experiments I consider two extreme cases – where all the
points are strictly made up of one type (either by 2-pointers or 1-pointers). I
also consider the case where there is a mix of types. I aim to keep the total
number of points about the same to more properly observe the effect of just
changing the story estimates on the time that it takes to finish the stories.
Note that the titles of the probability distributions plots with
area-under-the-curve shaded assume a sequential total of hours (i.e. only one
stream of development is happening at once). If it says there is an X% chance
that a set of tasks will get done by 24 hours, this only assumes that one
developer or one pair is working on finishing stories one by one.
A divide-and-conquer strategy will be discussed below for projects that are parallelizable.
Nine 1-pointers
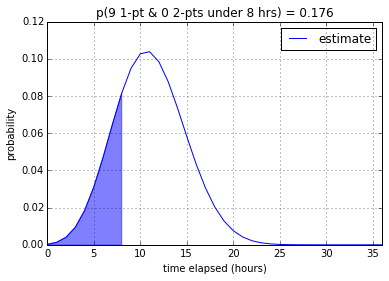
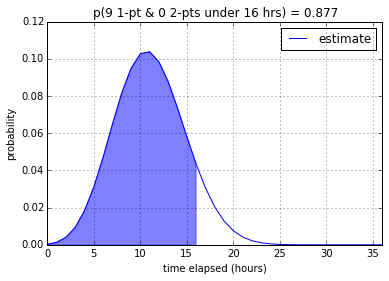
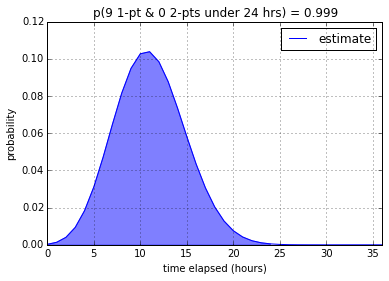
With regards to nine 1-pointers, our model is not very confident (17.6%)
that the tasks can be done in one work day. However it is very confident that
it can be done under 2-3 work days (87.7% and 99.9% respectively).
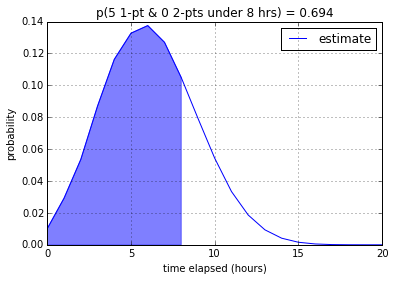
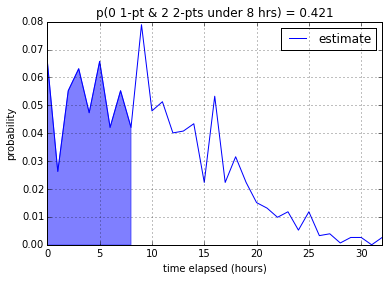
Five 1-pointers and Two 2-pointers

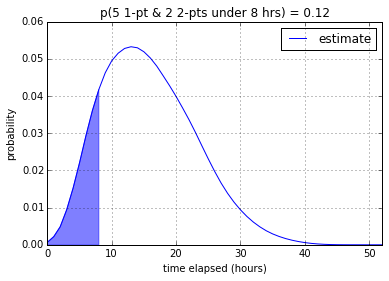
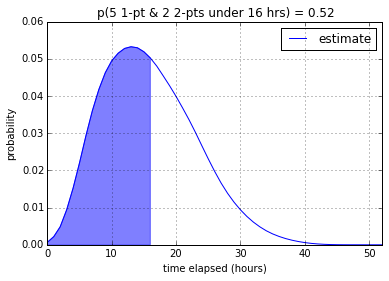
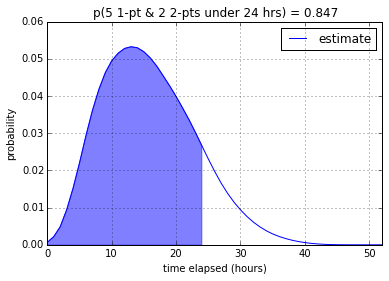
According to my program, a developer (or two developers working as a pair) from
my team will be able to finish the 5 1-point and 2 2-point stories with
12.0% confidence in 8 working hours, 52.0% in 16 working hours, and
84.7% in 24 working hours. It makes sense that the introduction of
2-pointers significantly lowered the confidence – even though the total
number of points stays the same – since 2-pointers have much more
variability.
Four 2-pointers
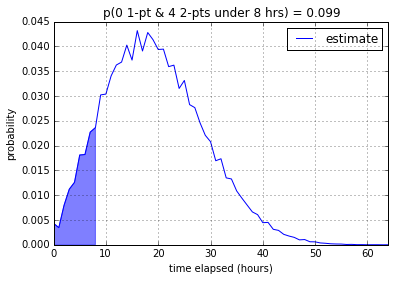
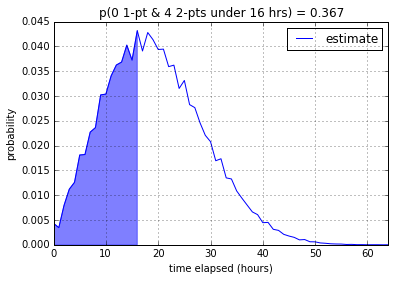
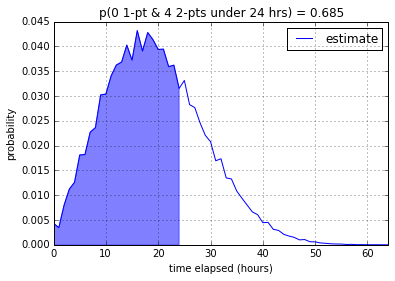
8 working hours gives us a measley 9.9%. 16 working hours gives us
36.7% and 24 working hours gives us a much better 68.5% chance that
the four 2-pointer stories will be done under that time constraint.
This is inline with my thinking – that a milestone with 2-pointers probably
will take longer to do than a milestone with 1-pointers, given equal total
estimates. In this case, the milestone with 4 2-pointers is much more
likely to take longer than 9 1-pointers, even though the total points
assigned to the former is less than the total points assigned to the latter.
Parallelization
So far the assumption all along is only one developer (or a couple of
developers working as a pair) will work on the stories sequentially. But what
if you are planning to parallelize the work? Let’s take, for example, the case
where there are 5 1-pointers and 2 2-pointers and we assume that the
stories are parallelizable and that we have one lone wolf and one pair of
developers. A project manager might assign the 2 2-pointers to the pair
and assign the 5 1-pointers to the lone wolf because 2-pointers are
usually more difficult than 1-pointers. Let’s assume that the big deadline
is in 8 working hours.
We assume that the probability of getting the five 1-pointers done,
\(P(X)\), is independent of getting the two 2-pointers done, \(P(Y)\),
because one should not influence the other. The probability of them both
happening at the same time is:
Looks like we might have to do some overtime…
Code
You can access my code here. Follow the instructions in the readme so that you can start analyzing and make predictions based on your team’s previous performances on a project.
Caveats
The distributions for 1-point stories and 2-point stories did not make a
distinction as to which stories were done by pairs and which stories were done
by a single person. It is possible that performance between pairs and
developers might have a lot of variation in my team (and other teams), and this
might make our model underfit in those situations.
Another similar caveat is that it is assumed that a developer in the team is more or less as competent as the others in the team and get stories done in about the same time as every other developer in the team. People who might want to use my code to munge their own data sets should take this into account (especially if newbie junior developers are present). They might want to have a more fine-grained probability distribution of estimates over time (i.e. have a junior 1-pointer probability distribution and a senior 1-pointer probability distribution) to take into account the difference in familiarity with the tech stack and overall skill level between junior and senior developers.
Another caveat I have is that the code for calculating the probabilities only
assumes that a project only has 1-point and 2-point stories. We usually don’t
have stories larger than 2-point stories because we break those down into
smaller ones. It wouldn’t be hard to take those into account, however. You could
take my code as a starting block, and change the prob_get_done function to take
into account 4-pointers, 8-pointers, etc.
Conclusion
Total of assigned points in a milestone might not be sufficient in accurately predicting how long the milestone will take to get finished. I have come up with a way to incorporate variability introduced by different point estimates into determining what the probability of hitting a milestone is, based on past activity. I hope that this might be able to guide software development teams in accurately and reliably reporting estimates so that businesses can make better decisions.